
Your Facebook reach is an important metric to take into account when analyzing whether your efforts on Facebook are paying off. After all, to know whether the number of people engaging with your content is any good, you need to know how many people that content actually reaches.
But what exactly is Facebook reach?
What Does People Reached Mean on Facebook?
Facebook reach refers to the number of unique users who saw your content. It’s often confused with impressions, which refers to how many times your content has been served or viewed. For example, one post can be seen by the same user twice. In this case, the reach is one, but the number of impressions is two.
The Evolution of Facebook Reach
If there is one thing we have learned in all of our years of social media marketing it’s that Facebook is constantly changing things. We first wrote this post in early 2015 when the average Facebook reach was about 4.11% of total Page likes. Meaning for every 100 people who liked a Page, only 4 of them actually saw a post in their News Feed.
In 2017, the average reach of a Facebook post had already gone up to 8.92%.
In January 2018, however, Facebook CEO Mark Zuckerberg announced a huge change to the algorithm. Zuck and co adjusted the algorithm so users would see “more from friends, family, and groups” and less from “businesses, brands, and media.” Yikes!
Fast forward to 2020, where whether or not a post appears in someone’s newsfeed depends on three ranking signals that are based on a user’s past behavior:
- who a user typically interacts with.
- the type of media in the post.
- the popularity of the post.
Facebook also introduced an explanation for users to understand why they’re seeing a particular post in their newsfeed and gave them the option to tell the algorithm directly what’s important to them and if they’d prefer to see more or fewer posts from a particular page or person.
And the changes haven’t stopped. Mid-April 2021, Facebook announced they’ll again adjust which posts get priority in the newsfeed by collecting more user feedback.
Facebook will always make adjustments to its algorithm and each time they do, that can have an effect on your Facebook reach. However, one constant remains: Writing quality content that people WANT to engage with – while varying that content and posting it on a regular schedule (thanks to your easy Facebook scheduler) – remains key for success on the platform.
How does your Facebook reach compare to other pages?
Everybody wonders sometimes. You peek at the organic reach for every Facebook update you post, and the numbers aren’t what you’d hoped. They aren’t even what you expected. You’ve seen people with higher bowling scores. And you can’t help but wonder:
Does my Facebook Page suck?
It’s frustrating when it feels like nobody is seeing your posts. Sometimes it seems like you’re the only person who doesn’t have the whole thing figured out – like there must be one simple, glaring thing you’re doing wrong and just need to fix, like plugging the hole in a sinking rowboat.
That’s when it’s time to get a little perspective on your Facebook reach and check if your numbers are really that bad. To do that, you can’t just look at your own stats – you need to have something to compare them to.
Today, we’ll use these findings from 2019. Hootsuite compiled the statistics for thousands of Facebook Pages, and came up with results you can use to contextualize your own. (Hint: If you need a refresher on how to access Facebook data beyond what you get on your Insights tab, this shows you what to do.)
Here’s an example.
According to their study, the average organic reach for a Facebook post is 5.5%, a drop of 2.2% from 2018. Here’s how you can see how your Page stacked up.
First, use the Post Data spreadsheet you can download directly from Facebook (again, here’s how) to add the reach for every update you post to your Page over the last month. (Remember to look at organic reach, not total!) Let’s say your total organic reach for the month is 50,000 users. Divide that by the number of updates you posted (let’s say 20 updates), and you’ll get an organic reach of 2,500 users per post.
Because your Page’s number of likes is probably different at the end of the month than it is at the beginning (let’s say yours grew by more than 2,000), again, make sure you average your Page’s likes over January’s 31 days. Add up the numbers in your “Lifetime Total Likes” column (in the Page Data spreadsheet) and divide by 31 to get your average.
Divide the average number of users reached per post by the average number of total Page likes, and you’ll have your average reach. Don’t be discouraged if you get a result below the average of 5.5%!
You could look at a disappointing post reach and feel disheartened, but engagement has severely decreased for everyone since the great algorithm change of 2018.
While the change pushed more businesses towards paid advertising, the upside is that Facebook wants people to create communities and love the content they see on their page. So if you focus on building that community, there are a ton of opportunities for your Page.
Look Beyond Facebook Reach
So now you know how your reach compares to the average – but reach isn’t the only thing that matters, either. Not by a long shot.
It means people seeing what you post and actually taking action, instead of scrolling on past without a second thought. And it’s easy to measure your own.
On your spreadsheet, look at the Lifetime engaged users column. This gives you the engagement for each individual post. Add them up (hint: use the sum function instead of doing it manually) to get your total engagement for the month, then divide that number by your total number of people reached to get your engagement rate.
According to the study, the average engagement rate was 3.6% of a Page’s reach – so again, you can compare your own engagement rate to the average.
And what if yours is really low? How can you get a better engagement rate?
Well, that’s the other nice thing about spreadsheets like this – they make it easy to identify what’s working and what isn’t. For example, you can sort all of the updates in your sheet in order of engagement rate, so you can easily pick out patterns in what people liked the best, the least, and so on.
Pay attention to factors like:
- Type of update
- Time of post
- Day of the week
- Message phrasing (A question? A statement? Funny? Serious?)
Don’t be discouraged if you don’t recognize any immediate patterns – especially if you’re looking at a relatively small period of time, like a single month. Try going back to your Insights page and exporting data for a broader range, like several months, and you may notice things that weren’t apparent in a smaller data set.
The types of content you share
Facebook’s algorithm changes are generally inspired by the way people interact with content in the News Feed – and that means the type of content you share matters.
For example, Facebook found that users prefer clicking updates that share URLs using a link preview, rather than by slipping them into the captions of image posts – so link previews get better reach.
Similarly, Facebook found that people tend to like live video broadcasts more than pre-recorded ones, so now live video takes precedence in the News Feed.
Facebook doesn’t just look for the stuff it likes when it’s figuring out the reach for your posts, though – it looks for the stuff it DOESN’T like.
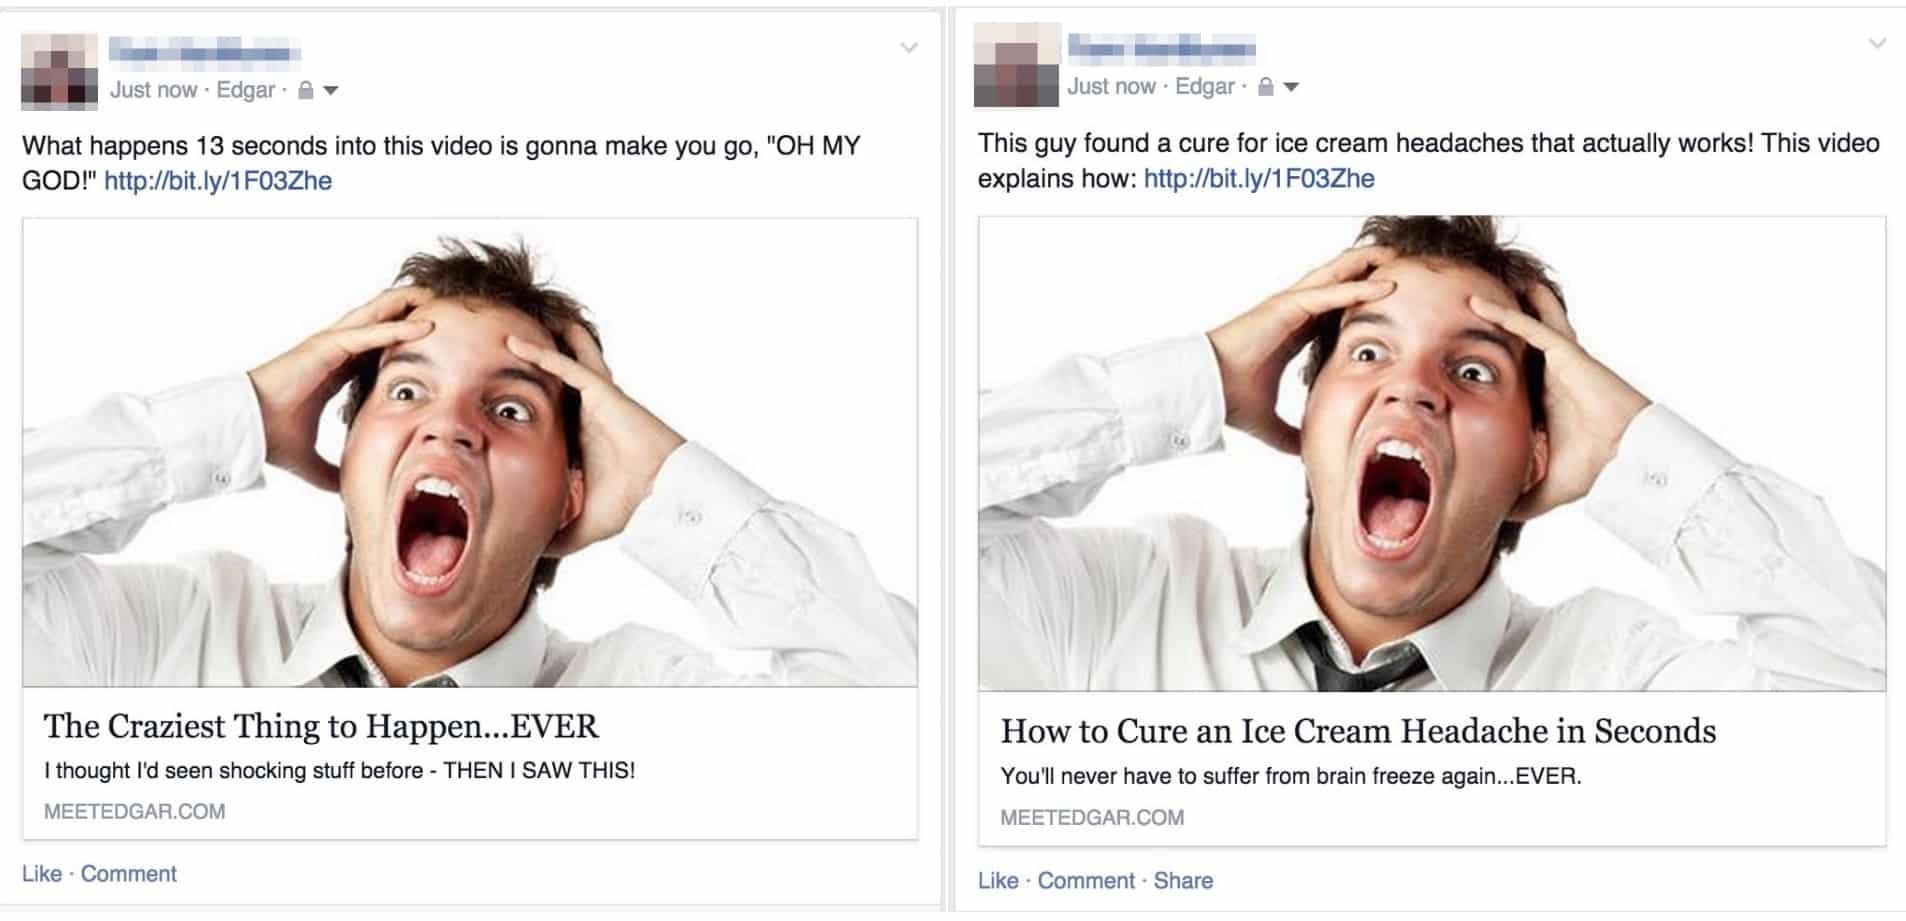
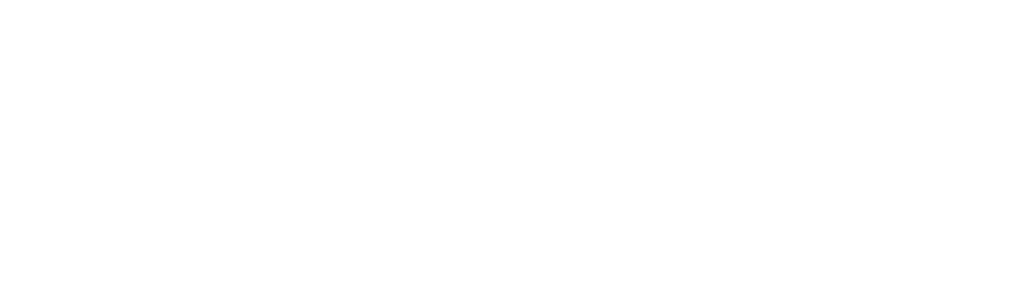
Click-bait links, for example, have been a major victim of algorithm changes – mostly because they’re tailored to boost clicks and drive traffic without necessarily being all that valuable. It’s a tactic that worked in its prime, but users kind of hated it, too, so Facebook started devaluing those kinds of links and giving them less reach.
(One way it learned to identify click-bait was by monitoring engagement, but Facebook can also determine how long you stay on a page after clicking through to it from your News Feed. If you’re not there very long, it might indicate that the link was click-bait.)
Another type of update Facebook doesn’t like to see?Like-baiting.
(Probably best to avoid any strategy that regards your followers as comparable in intelligence to a largemouth bass.)
Like-baiting is another way of trying to rack up big engagement numbers with low-quality content – in this case, updates that ask your followers to engage in a specific way, like this:

Facebook and its users prefer content that gets engagement organically.
Because Facebook can detect like-bait, it can limit the reach for an update like the one pictured above – and a Page that habitually posts that sort of content may see its overall reach drop over time.
On the other hand, an alternative type of update that “>encourages engagement – by starting a conversation, for example – works much better.

A marketing strategy doesn’t have to have “bait” in the name for Facebook to dislike it, though.
For example, Facebook has found that users hate feeling tricked by a headline – whether it’s a hoax post or intentionally misleading, it’s the type of content that’ll hurt your page’s typical reach over time.

Facebook determines whether a post is misleading largely by user feedback and reports – and those types of reports are actually just one piece of a much bigger puzzle.What users want
Facebook’s algorithm doesn’t rely just on engagement to determine if users like what they see – because as we’ve seen, metrics like those have been easy to manipulate in the past.
Instead, by soliciting and tracking user feedback over time, it’s learned how to accurately predict how valuable you might find the content in your News Feed,even if you don’t engage with it.
The lesson? Focusing on quality first is way more valuable than trying to work the system.
[easy-tweet tweet=”Facebook’s algorithm changes have always been about encouraging better updates.”]
Now see how you’re performing
That’s all there is to it – now you know how to figure out your own average organic reach, as well as your average engagement. So download your data from your Facebook Insights tab, compare it to the average, and see exactly how you’re doing compared to the other pages out there!
10 Comments
really insightful and in depth post with a ton of great value!
Hello Team Edgar,
my facebook page launched 1 month ago and I have 220 likes. Average reach is >120 and on many posts it exceeded 350 (organic); actually reached 500 once! How do you evaluate my progress?
Sounds like you’re off to a strong start!
Hello Team Edgar,
My average organic reach is 34 users per post and my average total likes is 0.67 likes per post. Thus, when I use the equation to get the average reach, it ends up giving me 5,074.63%.
I highly doubt my reach is that good -especially with those average likes. Would you happen to know what I’m doing wrong?
Thank you,
Diego
Hi Diego! You want to use the total likes for your Facebook Page overall, not the average total likes per post. So if your Facebook Page has, for example, 500 likes, and your average organic reach is 34 users per post, then your average reach would be 34 divided by 500 (6.8%). Hope that helps!
useful, thanks but in this bit: “Divide the average number of users reached per post by the average number of total Page likes, and you’ll have your average reach” you need to then times by 100 to express as a %?
Right! For example, if your average reach is 20 people, and your Page has 100 likes, 20 divided by 100 equals .2 — which is the same as 20 percent.
We generally focus more on reach than impressions, because that tells us how many people saw something, rather than how many times something was seen. (Impressions can be higher than reach, because if a single user sees the same update more than once, it counts as multiple impressions.)
I don’t get it, is it the 4ish percent or the 8ish percent? You seem to go back and forth the whole article and it’s pretty confusing
Hi John! The 8.92% figure refers to reach, while the 4.32% figure refers to engagement. Hope that helps!