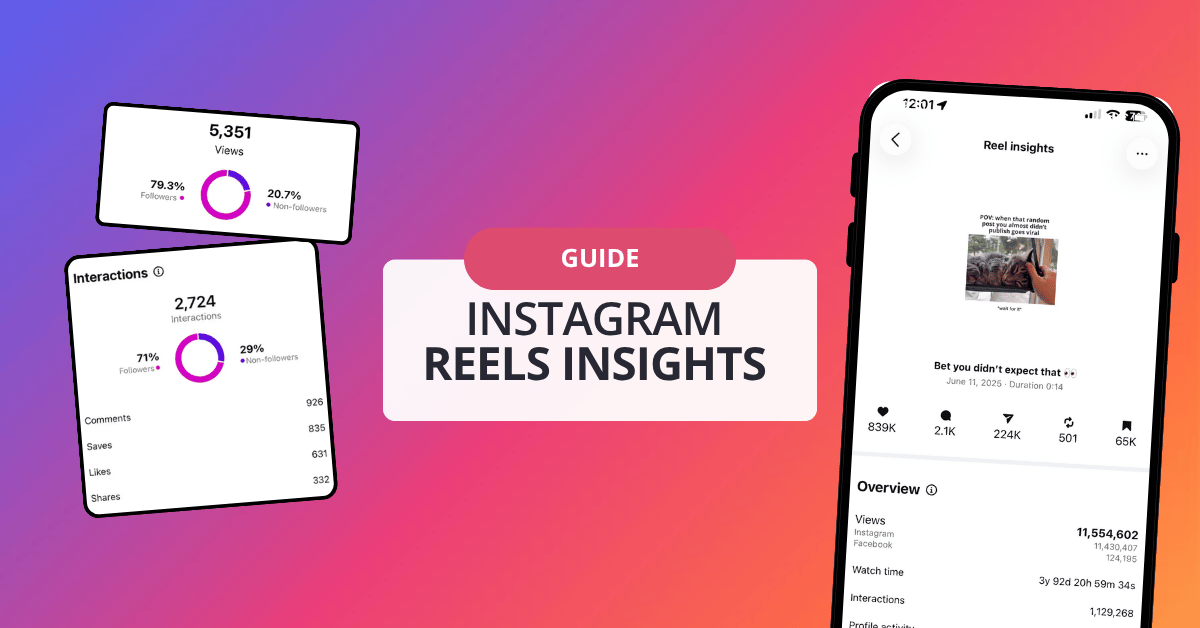
In this article
You put time into planning, recording, and editing a Reel, only to watch it receive fewer views or interactions than you expected.
What happened?
Your Instagram Reels analytics may already contain the answer.
Views can tell you how many times a Reel was watched, but they do not explain what happened during the video. Your retention graph goes deeper by showing when viewers continued watching and where they started leaving.
A sharp drop at the beginning might point to a weak opening. A sudden decline later could mean the content did not deliver what the hook promised. A relatively steady line may show that your topic, pacing, and structure held people’s attention.
This guide explains how to access Instagram Reels Insights, what the available metrics mean, and how to use common retention patterns to improve your next Reel.
How to Access Your Reels Insights
Instagram Insights are available to professional accounts, including Business and Creator accounts. The exact labels and layout may vary depending on your device, account, and version of the Instagram app.
To review the performance of an individual Reel:
- Open the Reel from your profile grid or the Reels tab.
- Tap View Insights underneath the Reel (on some app versions, this is under the ... menu).
- To compare several Reels at once, go to your profile menu > Insights > Content You Shared, then filter by Reels.
- On desktop, Meta Business Suite shows the same data under Insights > Content.
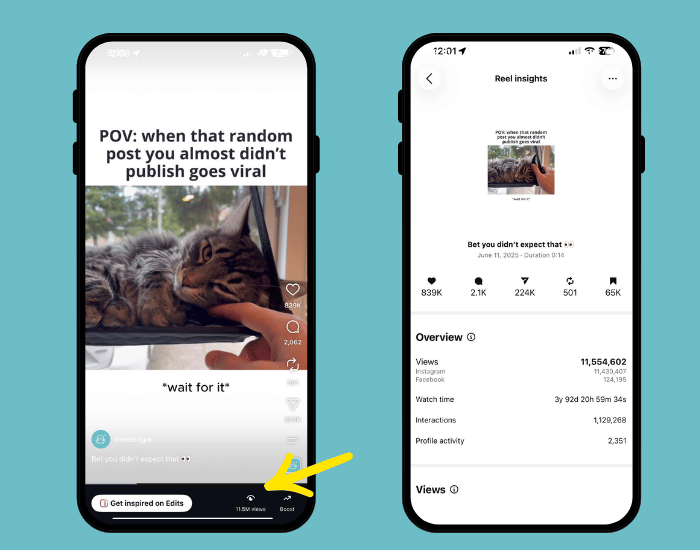
You can also access broader account-level insights from your professional dashboard. However, opening an individual Reel is usually the easiest way to understand why that specific piece of content performed the way it did.
Avoid judging a Reel by one number. Views tell you how often it was watched, but they do not explain whether people stayed, engaged, visited your profile, or followed your account.
What Do Instagram Reel Metrics Mean?
The exact metrics shown may differ between accounts, but these are some of the most common numbers you may find in Instagram Reels Insights.
How to Read Your Instagram Reel Retention Graph
The retention graph is a line that starts at 100% and shows what percentage of your audience is still watching at every second of the video.
Its shape is the most useful diagnostic tool in your entire Reels Insights, because it tells you exactly where people leave, not just how many of them do.
Here's how to read the five shapes you'll most commonly see. Use the following decision tree to interpret common retention patterns.
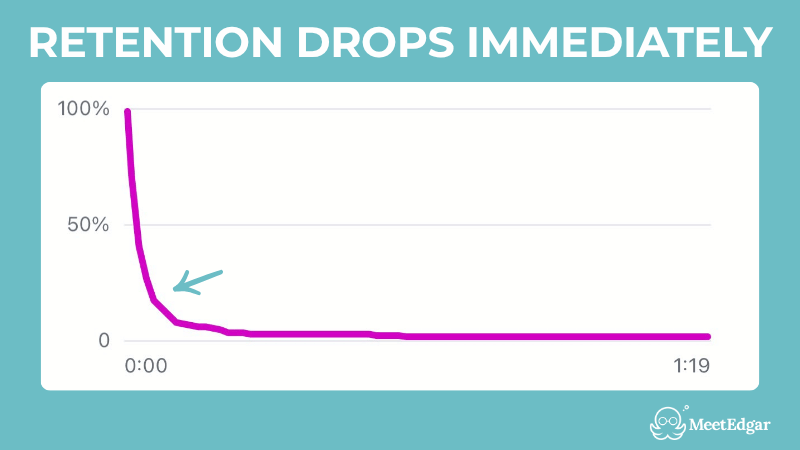
Graph 1: Sharp Drop at the Beginning
What it may mean
Viewers started the Reel but left almost immediately.
This commonly points to an issue with the opening. Your first frame or first sentence may not have communicated why the video was worth watching.
Possible reasons
- The hook was unclear or too general.
- The video began with a long introduction.
- The opening frame did not show what the Reel was about.
- The topic was not relevant to the audience that received it.
- The on-screen text was difficult to read.
- The Reel took too long to reach the main idea.
- The opening promised something viewers did not want or need.
What to test next
Rebuild your first 1–2 seconds around a visual surprise, a bold on-screen claim, or a question your audience needs the answer to. Cut any setup before the hook; the hook should be the first thing on screen.
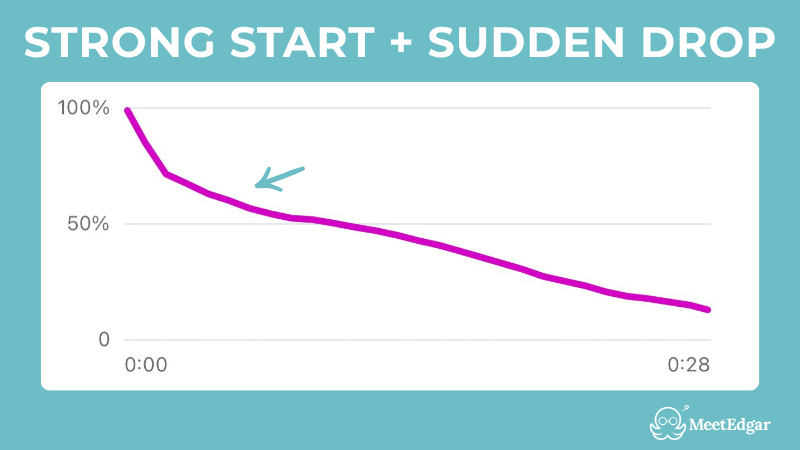
Graph 2: Strong Start, Then a Sudden Drop
What it may mean
Your hook successfully created interest, but the content that followed did not meet the expectation it created.
Viewers initially thought, “I want to know more,” but something shortly afterward made them decide the Reel was not what they expected.
Possible reasons
- The body did not deliver on the hook.
- The topic changed after the introduction.
- The opening exaggerated what the Reel would provide.
- The explanation became confusing.
- A transition interrupted the momentum.
- The Reel delayed the promised answer.
- The visual and spoken messages did not match.
What to test next
Watch the exact second where the drop happens. That's usually where the Reel shifts from the hook into the "real" content.
Make the connection between your hook and your main point immediate.
For example, if the opening says, “Three mistakes hurting your Reel reach,” begin with the first mistake. Do not spend ten seconds explaining why social media is important.
Tighten that transition, deliver the payoff faster, or make sure the hook is actually about what the rest of the video covers.
Graph 3: Viewers Leave Midway

What it may mean
The opening worked, but the Reel lost momentum in the middle.
This can happen when a useful idea is stretched into a longer video than it needs to be, or when the structure becomes repetitive.
Possible reasons
- The Reel was longer than the idea required.
- The explanation repeated the same point.
- The pace slowed down.
- There was too much background information.
- The middle contained pauses or unnecessary footage.
- The most valuable information came too late.
- Viewers had already understood the point and did not need the rest.
What to test next
Try shortening the Reel without removing its essential value.
Add a pattern interrupt around the midpoint (a text callout, a cut, a change in framing or tone). Cut any sentence or shot that doesn't add new information. If you can say it in fewer seconds, say it in fewer seconds.
Graph 4: Viewers Stay, Then Leave Near the End
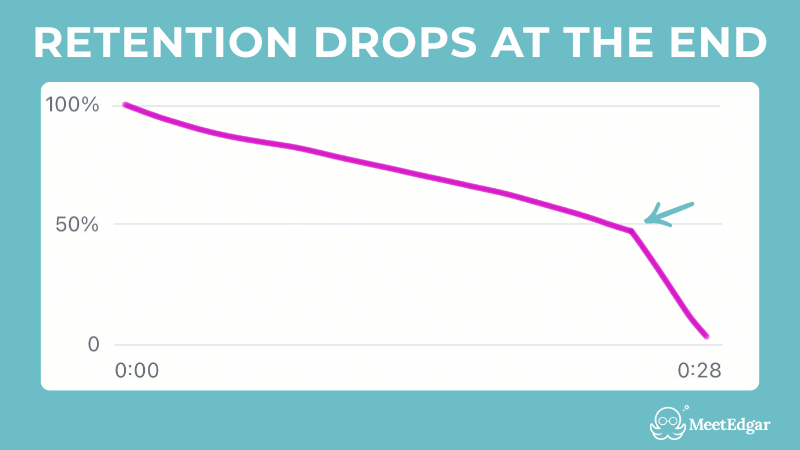
What it may mean
The main content probably held viewers’ attention, but the ending may have continued after the value had already been delivered.
This is not necessarily a bad result. If viewers received the full answer before leaving, your Reel may still have accomplished its purpose.
However, a large final drop can show that the ending or call to action needs tightening.
Possible reasons
- The Reel repeated its conclusion.
- The ending lasted too long.
- The call to action felt disconnected from the topic.
- You asked viewers to take several actions at once.
- The video included a long branded outro.
- The useful content ended before the Reel did.
What to test next
End as soon as the message is complete. Add (or strengthen) a clear payoff or CTA before your usual drop-off point.
If you're delivering value through the whole video but never explicitly telling people what to do next (follow, save, share), that's the gap.
Graph 5: Retention Stays Relatively Strong and Constant
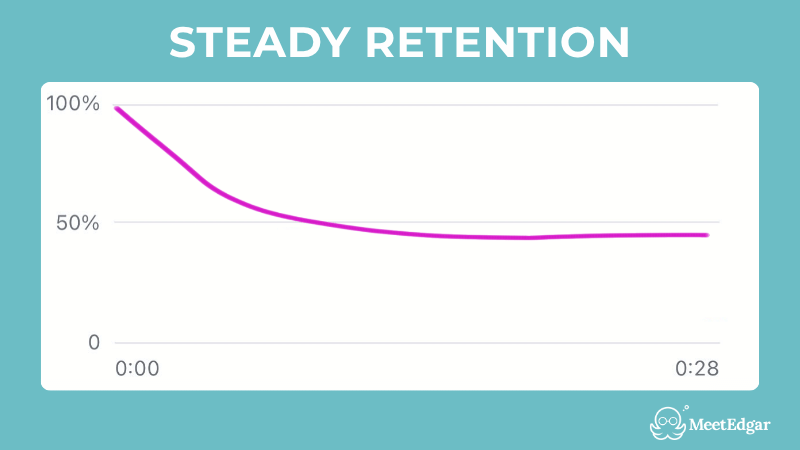
What it may mean
Some decline is completely normal. But if your retention line stays relatively steady without any major drops, your hook, pacing, and message likely kept viewers interested throughout most of the Reel.
This means you delivered great content.
Now study what worked:
- Was the topic especially relevant?
- How quickly did you introduce the main point?
- How long was the Reel?
- Did you use a story, list, demonstration, or tutorial?
- How frequently did the visuals change?
- Was the ending concise?
- Did viewers save, share, or follow afterward?
Use those insights as a blueprint, not a rigid formula. Create another Reel that applies the same strengths to a different topic.
All these graph patterns are diagnostic clues rather than absolute rules. A drop may have several causes, so review the Reel at the corresponding timestamp before deciding what to change.
The Metrics That Actually Move Your Reach on Reels
Retention tells you how successfully a Reel held attention. It does not tell you everything the Reel accomplished.
Review it alongside:
- Reach: Did the Reel reach new people?
- Shares: Did people find it worth passing along?
- Saves: Was it useful enough to revisit?
- Profile activity: Did it create curiosity about your account?
- Watch time: Did it support a broader business goal?
For example, an entertaining Reel might maintain strong retention but attract few potential customers. A specific tutorial might reach fewer people while producing more saves, profile visits, or qualified leads.
Two numbers are worth benchmarking against your own account size rather than a flat target:
Skip rate. A 2026 analysis of 140,000 Instagram Reels found average skip rates run high across the board: around 65.5% for accounts under 5,000 followers, improving gradually to 60.5% for accounts nearing 1 million. Don't chase an arbitrary low number; watch whether your own skip rate is trending down and sitting near accounts your size.
Reel length. The same research found reach rate peaks for Reels between 30 and 60 seconds, at roughly 5.6% average reach rate, and drops steadily as length increases:
If your Reels consistently run past two minutes, that alone could be capping your reach before content quality even enters the picture.
Tips for Creating Better-Performing Instagram Reels
1. Make the first frame useful
Do not make viewers wait to understand the subject.
Use the first frame to communicate the topic, problem, result, or question. This could be a clear text hook, a visual demonstration, or the final result shown before the explanation.
2. Deliver on the hook quickly
A hook should set an accurate expectation, not create curiosity that the rest of the Reel fails to satisfy.
Make sure the opening and main content feel like parts of the same promise.
3. Focus on one central idea
Trying to teach five complicated concepts in one short video can weaken the structure.
Choose one takeaway. Additional ideas can become future Reels.
4. Remove anything the viewer does not need
Review your script and ask whether each sentence helps the viewer understand the message.
Trim repeated points, lengthy transitions, greetings, and background information that does not improve the explanation.
5. Put the payoff earlier
Do not save the best insight for the final second.
Show the result or central idea early, then use the rest of the Reel to explain how or why it works.
6. Use one clear call to action
Asking viewers to follow, comment, save, share, visit your website, and send a message all at once can make the ending feel cluttered.
Choose the action most closely connected to that Reel.
7. Test one meaningful change at a time
If you change the topic, length, hook, format, visual style, and call to action simultaneously, you will not know which adjustment affected the result.
Try changing one major variable, review the data, and apply what you learn to the next post.
Stop Guessing and Start Testing
A Reel that underperforms is not necessarily wasted effort.
Its retention graph can show where viewers left, help you form a reasonable explanation, and give you something specific to test next.
Start with the pattern:
- An immediate drop points toward the opening.
- A sudden decline after the hook may indicate a mismatch.
- A midpoint drop can signal pacing or length problems.
- A late decline may mean the ending needs work.
- A steady line suggests that the content held attention well.
Then change one thing, publish another version, and compare the results.
Once you know what resonates, MeetEdgar can help you organize your content, schedule and auto-publish Instagram Reels, and maintain a more consistent posting workflow. Its Content Library and scheduling tools make it easier to turn what you learn from your analytics into an ongoing content plan, without returning to Instagram every time you need to publish.